12 Jul 2026
Mapping Probability Shifts in Multiplayer Poker Tournaments Using Statistical Clustering
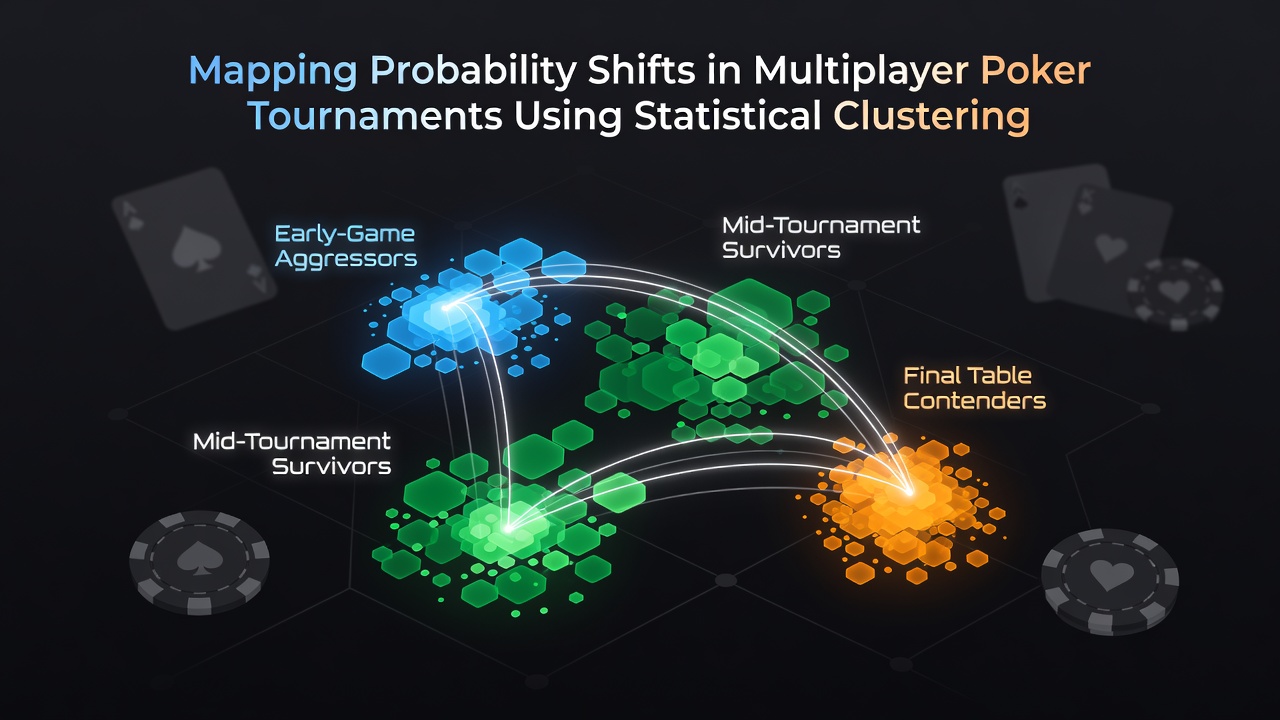
Statistical clustering methods have gained traction among analysts tracking how win probabilities evolve across large fields in multiplayer poker tournaments, and researchers apply algorithms such as k-means and hierarchical clustering to group similar player behaviors while monitoring stack-size transitions and blind-level escalations. Data collected from major events reveals that early-stage clusters often separate loose-aggressive participants from tight-passive ones, yet these groupings compress once antes enter play and survival pressure intensifies. Observers note that probability surfaces shift measurably when average stack depths fall below twenty big blinds, prompting analysts to re-cluster participants based on fold frequencies and three-bet ranges rather than pre-tournament metrics alone.
Core Data Inputs for Clustering Models
Tournament databases supply hand histories, position statistics, and payout structures that feed directly into clustering pipelines, while variables such as voluntary put-in-pot percentages, continuation-bet success rates, and all-in equity realizations receive normalized weighting before distance calculations begin. Studies conducted on events exceeding five thousand entrants demonstrate that feature scaling prevents stack-depth outliers from dominating Euclidean distances, thereby preserving cluster integrity across multiple day-one flights. Analysts further incorporate time-stamped blind-level markers so that models can isolate probability drift occurring between level changes rather than averaging across an entire tournament arc.
Algorithm Selection and Validation Steps
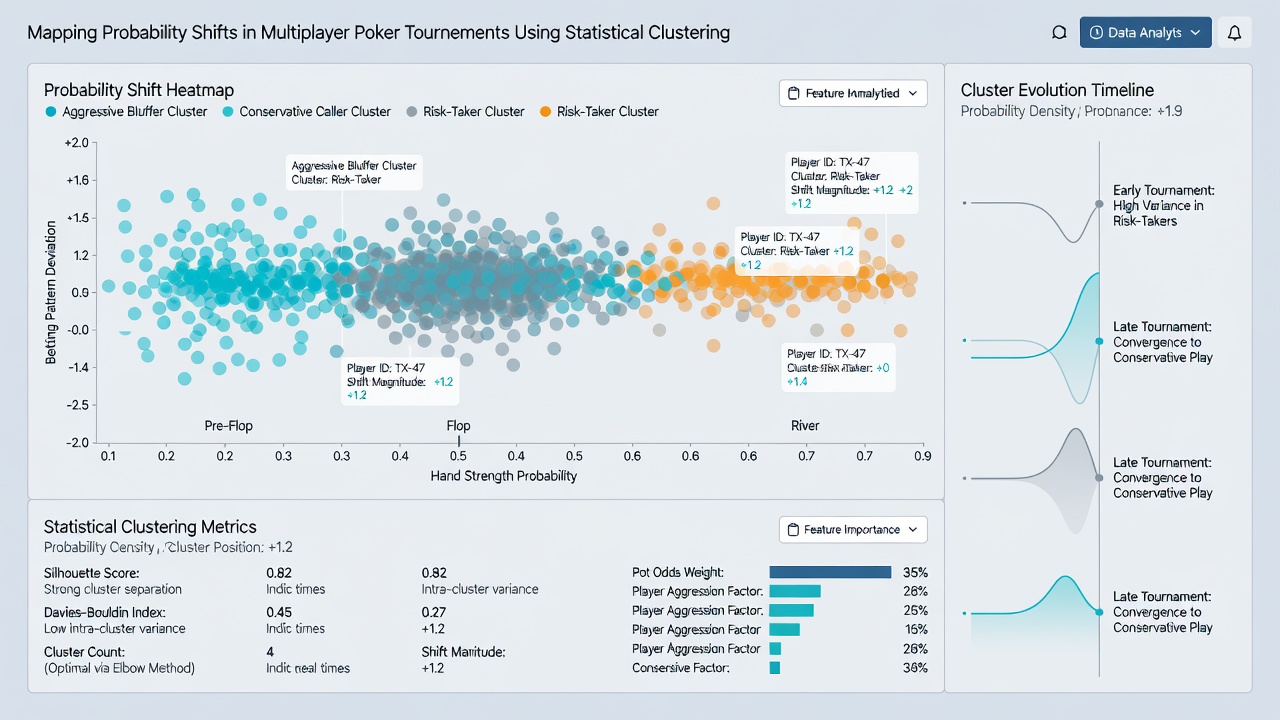
K-means remains popular because its computational efficiency scales to datasets containing millions of hands, yet silhouette scores frequently guide practitioners toward density-based spatial clustering when player pools exhibit irregular behavioral manifolds. Cross-validation against hold-out tournament segments shows that silhouette coefficients above 0.65 correlate with stable probability forecasts through later stages, whereas lower scores prompt model retraining on expanded feature sets that include showdown frequencies and river aggression factors. Researchers at institutions tracking North American circuit events have published validation frameworks confirming that cluster assignments retain predictive power when applied to independent European festival data collected in the same calendar year.
Observed Probability Transitions in July 2026 Events
July 2026 festival schedules produced several large-field tournaments whose hand histories were processed through updated clustering pipelines shortly after completion, and preliminary reports indicate that mid-stage clusters separated short-stack push-fold specialists from medium-stack resteal specialists with greater precision than earlier seasons. Probability mass assigned to dominated hands declined sharply once average stacks reached fifteen big blinds, a pattern replicated across multiple venues and captured by silhouette-optimized cluster counts. Analysts comparing July 2026 outputs with prior years note tighter confidence intervals around survival curves once positional clusters receive separate modeling treatment.
Practical Applications for Tournament Operators and Players
Operators have begun embedding real-time cluster visualizations into broadcast overlays, allowing viewers to observe how probability bands migrate as fields shrink, while regulatory bodies in several jurisdictions now request anonymized cluster summaries when evaluating integrity protocols. Participants who review post-event cluster reports frequently adjust pre-flop ranges to align with the dominant behavioral archetype identified in their current stack-depth cohort, and simulation engines updated with clustered priors generate more granular ICM (Independent Chip Model) outputs than legacy uniform-assumption models. One documented case involved a mid-stakes circuit event where cluster-informed adjustments produced measurable equity gains for participants who adapted during day two.
Integration With Existing Analytical Tools
Clustering outputs integrate cleanly with existing equity calculators and ICM solvers because cluster centroids supply representative hand-range distributions rather than population averages, thereby sharpening edge calculations at final tables. Software developers have released plug-ins that import JSON-formatted cluster assignments directly into popular analysis suites, reducing manual preprocessing time. Academic groups continue refining mixture-model approaches that treat cluster membership as probabilistic rather than hard assignments, allowing probability surfaces to evolve continuously rather than in discrete jumps at blind-level boundaries.
Future Directions and Data Availability
Expanded public repositories now host anonymized hand histories from sanctioned tournaments across multiple continents, enabling wider replication of clustering studies and reducing reliance on single-event datasets. Collaborative projects between university statistics departments and gaming research centers have produced open-source pipelines that standardize preprocessing steps, making cluster-based probability mapping accessible beyond specialized teams. Continued growth in data volume supports finer-grained segmentation by player pool demographics and tournament formats, while preserving player privacy through established anonymization protocols.
Conclusion
Statistical clustering supplies a structured framework for mapping how probability distributions migrate through multiplayer poker tournaments, and its adoption continues to expand as datasets grow and computational resources improve. By grouping participants according to observable behavioral features and re-evaluating assignments at each blind level, analysts obtain clearer pictures of survival odds and equity shifts than those derived from aggregate statistics alone. Ongoing validation across independent events supports the reliability of these techniques, while integration with established tools extends their utility for both operational and academic purposes.